NASA xGDS Analysis Notebook Built on iPython Notebook
The NASA xGDS Analysis Notebook is a new tool I'm developing that I'm really excited about. It's built on the iPython Notebook [1], an interactive MATLAB-like shell within a web browser that lets you do all kinds of numerical analysis and data visualization with just a few lines of Python code. I'm extending it with hooks to our live database and to simple customized plotting functions so our science teams can get right into analyzing their data.
The way the notebook works is pretty simple. It's split up into cells. You enter a command into a cell and it immediately displays the result below, then gives you a new cell.
Here's an example using NASA RESOLVE rover data where I quickly wrote a plotting function that queries records from two different database tables (neutron spectrometer data and position data), resamples both data sets to the same time frequency, aligns them by timestamp, and plots the result as a colored trail on a map. Even if you're not familiar with the functions we're calling, you can see these tools let us work quickly at a high level without sweating the details.
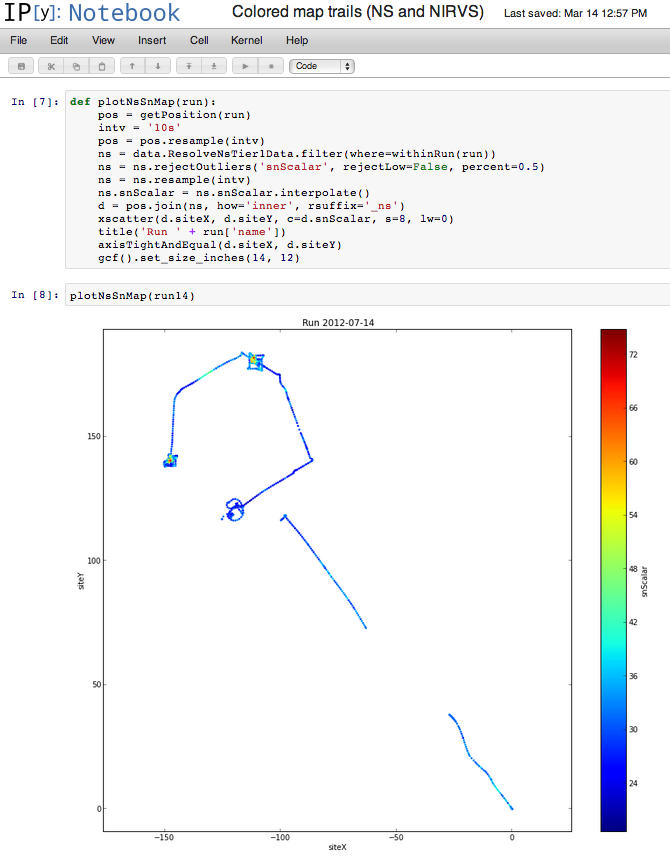
RESOLVE neutron spectrometer signal plotted as a colored rover trail on a map.
I'll have a lot to say about the analysis notebook going forward, but I thought I would start by putting it in context with the rest of the xGDS project.
xGDS develops software to support science operations, ranging from pre-mission planning to in-mission monitoring to post-mission data analysis. Until now, the data analysis part has been pretty thin. We had pre-configured displays that let you plot and map and search data, but no way to really process it.
The analysis notebook tool will give us a lot more depth in that area. You get a very flexible numerical toolkit and you can look for unexpected correlations between different data sets, check for agreement between measurements and numerical models, whatever you want.
We can compare the analysis notebook to our old approach of providing bulk data export to the science team in simple formats like CSV files, so they can import and analyze the data in familiar tools like Excel or MATLAB or IDL, and use specialized analysis tools developed for their discipline (like spectroscopy). We will absolutely continue supporting that and we believe it's vital, but it shouldn't be the whole story. Using the analysis notebook has some important advantages:
- Sharing. Sharing is on by default. If you make a new plot, everyone on the science team can see it right away, and if you update it they always see the latest version.
- Accessibility. You don't have to install expensive specialized commercial software to use the analysis notebook. Or, in fact, any software, except a web browser. That also means it's not restricted to any particular operating system. Cross-disciplinary collaboration is easier if the different disciplines can use the same tools.
- Self-documenting. Using the notebook encourages you to document your work processes. Anyone who can read your notebook sees not just your results, but also the techniques you used to generate them, so we can all improve our process by example. At its best, a notebook is not just a plot but a kind of scientific essay about what you're trying to understand and why you needed to process the data in the way you did. This relates to some important modern progress in the philosophy of science, as embodied in the reproducible research and literate programming movements.
- No export/import overhead. The notebook environment has "native" access to the live database, reducing the overhead of exporting data then importing into a new tool.
- Science/engineering collaboration. Especially important to us on the xGDS team, the notebook can be a way for us to work more closely with the science team. The scientists are experts on their instruments and on data interpretation, whereas we are experts in numerical data analysis and how the database is organized. Using the notebook collaborative environment, we should be able to do better data analysis together. (Plus, scientists are cool.)
Beyond post-mission data analysis, the other place the analysis notebook can help is as a prototyping tool for live console displays. We can work with a science team to try out lots of visualizations, pick out our favorites, then package them up for operational use as console displays that can update based on real-time data and handle the load from lots of users.
I also got some good initial feedback--this week I showed the analysis notebook to Tony Colaprete and Rick Elphic. Rick's top comment was that we need to connect the notebook to Google Earth so we can plot things in context with other map data. C'mon, Rick, don't throw me in that briar patch!
| [1] | There's actually a whole stack of libraries we're building on: iPython Notebook for the web-based shell, pandas for structured data analysis, matplotlib for plotting, and SciPy and NumPy for general numerical analysis. |